Adding Markers to Graphs
Completion requirements
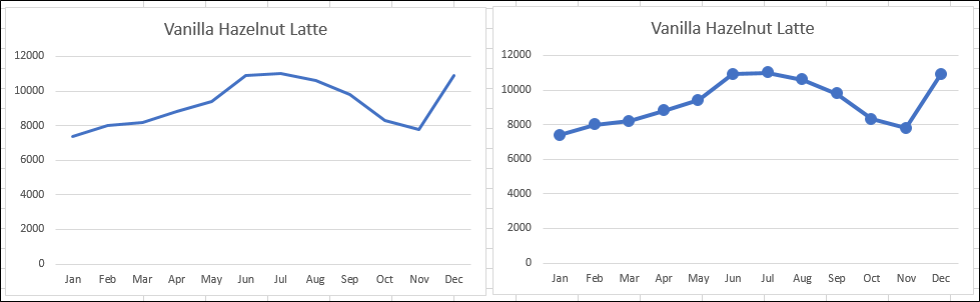
Some users find graphs are easier to read and interpret if the data points are included on the graph. Fortunately, spreadsheet applications allow those who create graphs to quickly change the style of the data series to display data points. By copying an existing graph and adding markers to one version of it, faculty can create two versions with only a few mouse clicks.
Last modified: Friday, December 8, 2023, 1:06 PM